Close Menu
  • Last News
    • Cities
    • Climate
    • Energy
    • Impact
    • Markets
    • Opinions
    • Policy
    • Reports
    • Research
  • About Us
  • Advertise
  • Contact Us

Subscribe to Our Newsletter

News, investigations, and analysis — our top stories every morning to start your day right.

Trending
Illustration of the sophisticated water management system beneath the Pyramid of Djoser in ancient Egypt.
“14 Million Cubic Feet Water Reservoir”: Ancient Egyptians Built Sophisticated Dam System Beneath Pyramid of Djoser for Hydraulic Construction
Illustration of Mark Steven Zuckerberg, an attorney from Indianapolis, dealing with social media account suspension issues due to name confusion with Meta's CEO.
“Five Account Suspensions in Eight Years”: Indianapolis Attorney Mark Zuckerberg Sues Meta Over Mistaken Identity With Billionaire CEO
Illustration of Mark Zuckerberg's superyachts, Launchpad and Wingman, navigating the fjords of Norway for a heliskiing adventure.
“$330 Million Fleet Crosses 5,280 Miles”: Mark Zuckerberg Uses Two Superyachts to Bypass Norway’s Helicopter Landing Regulations
Facebook X (Twitter) LinkedIn YouTube TikTok
Sustainability Times
Facebook X (Twitter) LinkedIn YouTube TikTok
Subscribe
  • Featured
  • Cities
    Illustration of Trojena Ski Resort's futuristic design in the Saudi Arabian desert.

    “We’re Building Winter Olympics in Pure Desert”: Saudi Arabia’s Trojena Ski Resort Hosts 2029 Asian Games Without Natural Snow

    09/09/2025
    Illustration of the historic Kiruna Church being relocated on self-propelled transporters to its new site in Sweden.

    “Sweden Moved a 700-Ton Church”: Historic Kiruna Building Traveled 3.1 Miles on Robot Transporters While King Watched the Journey

    09/03/2025
    Illustration of the transparent semi-cantilevered pool at Hotel MYS Khao Yai in Thailand, generated by artificial intelligence.

    “This Is a Death Trap for Rich Tourists”: Viral Thai Resort Pool Sparks Furious Debate Over Safety and Luxury Excess

    07/23/2025
    Illustration of Toronto's urban forest transformation with natural wetlands and diverse wildlife. Image generated by AI.

    Toronto’s Stunning Green Revolution Turns Canada’s Largest Metropolis Into a Vast Urban Forest Visible From Space

    07/01/2025
    Illustration of Downtown Residences skyscraper in Dubai's Business Bay area. Image generated by AI.

    “Tallest Home in the Sky”: Dubai’s 1,500-Foot Residential Tower Set to Shatter Records and Completely Transform the Urban Skyline

    06/14/2025
  • Climate
    Illustration of ocean heatwaves affecting marine ecosystems across the globe.

    “96% Of World’s Oceans Are Burning”: Record Marine Heatwaves Lasted 525 Days While Triggering Mass Coral Death And Fishery Collapse Worth Billions

    09/07/2025
    Illustration of Australia drifting toward Asia, symbolizing the impending geological collision.

    “Australia Will Crash Into Asia”: Continental Collision Already Disrupting GPS Systems While Scientists Warn Of Massive Extinction Event For Koalas And Kangaroos

    09/07/2025
    Illustration of the rapid melting of Himalayan glaciers and its impact on downstream water supply.

    “Millions Face Water Crisis Tomorrow”: Himalayan Glaciers Disappearing 10 Times Faster Than Predicted, Threatening Entire Nations’ Survival

    09/06/2025
    Illustration of Rapidly Expanding Mega-Drying Regions Contributing to Global Sea Level Rise.

    “There’s Very Few Places Now That Are Not Drying”: Continental Water Loss Surpasses Ice Sheets As Primary Driver Of Rising Sea Levels Worldwide

    09/05/2025
    Illustration of Clear-Air Turbulence Affecting an Aircraft in Flight.

    Aviation Experts Sound Alarm As Invisible Turbulence At 30,000 Feet Surges 55 Percent While Traditional Radar Systems Remain Helpless

    09/04/2025
  • Energy
    Illustration of China's First Domestically Developed 110-Megawatt Gas Turbine.

    “110 Megawatt Taihang Turbine”: China Launches First Domestic Heavy Duty Gas Engine Reducing 1 Million Tons Carbon Emissions

    09/13/2025
    Illustration of Wärtsilä's innovative marine engine technology aimed at reducing carbon emissions.

    “$100 to $380 Per Tonne Penalties”: Global Marine Carbon Tax Could Hit Ships Exceeding Emission Limits Starting 2028

    09/12/2025
    Illustration of the Sky Rover rooftop tent by Wild Land with its transparent roof and automated lift system.

    “$4,099 Remote Control Setup”: Wild Land’s Sky Rover Tent Features Pneumatic Lift System and Transparent Roof for Stargazing

    09/12/2025
    Illustration of a vast solar farm transforming the arid landscape and promoting ecological growth in northwestern China.

    “235 Square Miles of Solar Panels”: China’s Massive Qinghai Farm Transforms Desert Into Green Ecosystem Attracting Wildlife Herds

    09/12/2025
    Illustration of a washing machine with highlighted quick wash cycle settings.

    “More Water and Energy Than Expected”: Washing Machine Quick Cycles Spike Resource Consumption Despite Shorter Duration Times

    09/12/2025
  • Impact
    Illustration of Mark Steven Zuckerberg, an attorney from Indianapolis, dealing with social media account suspension issues due to name confusion with Meta's CEO.

    “Five Account Suspensions in Eight Years”: Indianapolis Attorney Mark Zuckerberg Sues Meta Over Mistaken Identity With Billionaire CEO

    09/13/2025
    Illustration of Mark Zuckerberg's superyachts, Launchpad and Wingman, navigating the fjords of Norway for a heliskiing adventure.

    “$330 Million Fleet Crosses 5,280 Miles”: Mark Zuckerberg Uses Two Superyachts to Bypass Norway’s Helicopter Landing Regulations

    09/13/2025
    Illustration of a disposable mask lying on the sidewalk.

    “Our Drinking Water Is Poisoned”: COVID Masks Release 4 Times More Deadly Microplastics Into Ocean Systems

    09/11/2025
    Illustration of the discovery of the "Welcome Stranger" gold nugget by British miners in Australia during the gold rush.

    “It Broke Our Pickaxe”: Miners Unearth 159-Pound Gold Nugget Worth $2 Million in Australian Dirt

    09/10/2025
    Illustration of Carlsbad Caverns' geological formations and the impact of human activity on its ecosystem.

    Tourist’s Forgotten Cheese Chips Trigger Catastrophic Ecosystem Collapse in 119-Cave Carlsbad Caverns UNESCO Site

    09/10/2025
  • Markets
    Illustration of the abrupt halt of a major lithium mine in China impacting global markets.

    “One Mine Shut Down and Prices Exploded”: CATL Halts Major Chinese Lithium Operation Sending Global Markets Into Chaos

    09/11/2025
    Illustration of the massive iron ore deposit discovered in the Pilbara region of Western Australia.

    Geologists Iron Find Worth $6 Trillion Sparks Geopolitical Firestorm As US-China Trade Rivalry Reaches Unprecedented Flashpoint

    08/24/2025
    Illustration of a colossal 55 billion-ton iron ore deposit discovery in Western Australia. Image generated by AI.

    Worldwide Panic as Monumental Geological Find Disrupts Global Trade and Triggers Market Turmoil on Every Continent

    06/04/2025

    Most sources of protein in the US contain vast quantities of microplastics

    01/11/2024

    Banking on change: How your accounts have climate impact

    12/27/2023
  • Opinions

    Sustainability, Family Offices, and Private Equity: A Powerful Alignment for Long-Term Impact

    08/05/2025

    Preserving Heritage While Innovating: How AI is Reshaping Design for a Sustainable Future

    07/23/2025

    Factories Without Real-Time Carbon Data Are Flying Blind: Why MES Must Become the Carbon Control Tower

    07/23/2025
    Illustration of the theoretical comparison between Earth's habitability and Mars' colonization prospects, generated by artificial intelligence.

    “Elon, Mars Is a Hellhole”: Astrophysicist Slams Musk’s Vision, Says Even Nuclear Apocalypse Makes Earth a Safer Bet

    07/14/2025
    Illustration of Millie, the 30-year-old tortoiseshell cat, enjoying a special cream cake on her birthday, generated by artificial intelligence.

    “Bottled Water Saved Her Life”: World’s Oldest Cat Millie Thrives at Age 30 by Drinking Only Premium Water, Stunning Veterinarians Everywhere

    07/12/2025
  • Policy
    Illustration of China's Underground Military Command Center Construction.

    “Satellite Images Reveal Vast Construction”: China Builds World’s Largest Underground Military Command Center Near Beijing for Global Power

    09/13/2025
    Illustration of the DF-5C Intercontinental Ballistic Missile Displayed During the Victory Day Parade in Beijing.

    “China Can Hit Any Target On Earth”: Beijing Unveils DF-5C Nuclear Missile With 12,427 Mile Range That Carries Ten Warheads While Putin And Kim Jong-Un Watch

    09/08/2025
    Illustration of China's Beijing Military City with a nuclear-proof bunker.

    “China Is Building A Nuclear-Proof War Command Center”: Beijing Military City Larger Than Pentagon Sparks Global Alarm As 2027 Modernization Deadline Approaches

    09/05/2025
    Illustration of China's massive underground military command center near Beijing revealed by satellite images.

    “Pentagon Said We Had No Defense Against This” China’s Underground Military Base Near Beijing Changes Everything Forever

    08/31/2025
    Illustration of frozen shrimp shipment inspection for radioactive contamination.

    Walmart Shoppers Alarmed: “Dangerous Shrimp May Harm,” Urged to Discard 5 Million Pounds of Product

    08/29/2025
  • Reports
    Illustration of the SABRE South Collaboration’s experimental setup for detecting dark matter in the Stawell Underground Physics Laboratory (AI-generated, non-realistic illustration). Credit: Ideogram.

    “Scientists Stunned by Mysterious Light”: Bold Experiment Uses 4-Inch Glowing Crystal Core to Unveil Secrets of Elusive Dark Matter

    05/05/2025
    Illustration of a precision laser being fired from Earth to a satellite orbiting the Moon during daylight (AI-generated, non-realistic illustration). Credit: Ideogram.

    China Hits the Moon With a Laser: First Daylight Lunar Reflection in History Stuns Scientists and Ignites Global Space Race

    05/04/2025
    Illustration of the SR-72 hypersonic jet soaring through the sky (AI-generated, non-realistic illustration). Credit: Ideogram.

    “China Stunned by US Jet”: SR-72 Hypersonic Aircraft to Fly at Over Mach 5 in 2025, Triggering Shock and Panic in Beijing

    05/04/2025
    Illustration of China's expansive underground military command center near Beijing (AI-generated, non-realistic illustration). Credit: Ideogram.

    China Unveils Its Military Mega-Project: Satellite Images Reveal Construction of the Largest Military Hub on Earth Spanning Over 1,000 Acres

    05/03/2025
    Illustration of China's new amphibious anti-tank missile system on the ZTD-05 vehicle (AI-generated, non-realistic illustration). Credit: Ideogram.

    “China Unleashes Amphibious Beast”: This Armored Truck-Turned-Tank Can Now Hunt Enemy Targets Across Rivers and Swamps

    05/02/2025
  • Research
    Illustration of the sophisticated water management system beneath the Pyramid of Djoser in ancient Egypt.

    “14 Million Cubic Feet Water Reservoir”: Ancient Egyptians Built Sophisticated Dam System Beneath Pyramid of Djoser for Hydraulic Construction

    09/13/2025
    Illustration of the South Atlantic Anomaly affecting Earth's magnetic field and space technology.

    “1,800 Miles Beneath Africa”: South Atlantic Anomaly Weakens Earth’s Magnetic Shield While Splitting Into Two Dangerous Lobes

    09/13/2025
    Illustration of the first-ever time crystal visible to the human eye.

    “First Time Crystal Visible to Human Eye”: CU Boulder Physicists Create Psychedelic Tiger Stripe Patterns That Dance in Perpetual Motion

    09/13/2025
    Illustration of the world's deadliest cancers highlighting their impact and challenges in treatment.

    “13% Five Year Survival Rate”: Pancreatic Cancer Remains Silent Killer With Symptoms Appearing Only in Advanced Stages

    09/13/2025
    Illustration of a brain scan highlighting structural differences associated with ADHD.

    “14 Volunteers Scanned on Four Machines”: Japanese Scientists Use Traveling Subject Method to Reveal Smaller ADHD Brain Regions

    09/12/2025
Sustainability Times
Home - Climate - Satellites help us with solutions to the urban heat island effect

Satellites help us with solutions to the urban heat island effect

Eirwen WilliamsEirwen Williams06/17/20220
Share Twitter Facebook LinkedIn Telegram WhatsApp Email Copy Link
Follow Us
Google News
Photo: Pixabay/geralt 
Share
Twitter Facebook LinkedIn WhatsApp Email Copy Link

Photo: Pixabay/geralt 

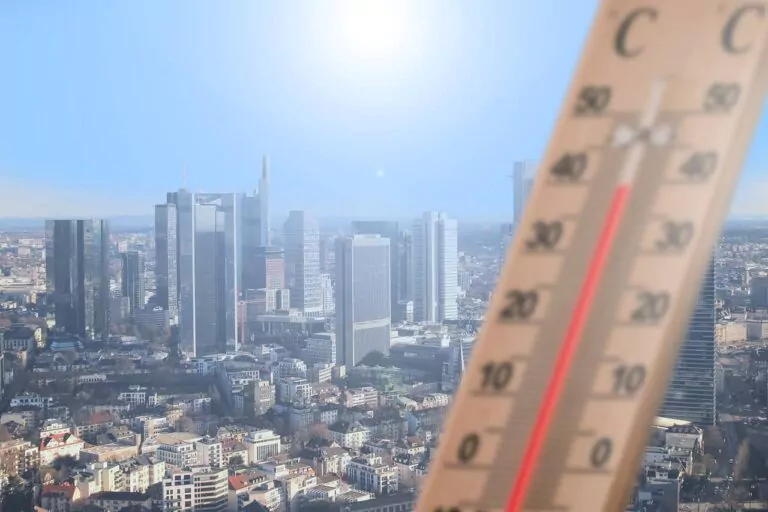
Spend time in a city in summer and you can feel the urban heat rising from the pavement and radiating from buildings. Cities are generally hotter than surrounding rural areas, but even within cities, some residential neighborhoods get dangerously warmer than others just a few miles away.

Within these “micro-urban heat islands,” communities can experience heat wave conditions well before officials declare a heat emergency.

I use Earth-observing satellites and population data to map these hot spots, often on projects with NASA. Satellites like the Landsat program have become crucial for pinpointing urban risks so cities can prepare for and respond to extreme heat, a top weather-related killer.

Among the many things we’ve been able to track with increasingly detailed satellite data is that the hottest neighborhoods are typically low-income and often have predominantly Black or Hispanic residents.

Two types of urban heat, both dangerous

The urban heat island effect was first described in 1818, over 200 years ago, in “The Climate of London” by Luke Howard, an early pioneer of meteorology.

There are two distinct types of urban heat island: the atmospheric urban heat island and the surface urban heat island. They are measured in different ways.

The atmospheric urban heat island, the phenomenon described by Howard, is simply the warmer air in urban areas relative to cooler air in outlying locations.

The surface urban heat island is the result of surfaces made up of heat-absorbing materials, such as asphalt, concrete and metal. Such materials are highly effective absorbers of heat energy from the Sun, and their surfaces warm rapidly and in turn emit the absorbed energy. You can feel the heat when you touch them.

The surface urban heat island directly contributes to the atmospheric urban heat island and is usually most intense on sunny days. Urbanization also contributes to the heat island effect through deforestation and the removal of other vegetation that would provide some cooling.

Where communities faces the highest heat

With rising global temperatures increasing the likelihood of dangerous heat waves, cities need to know which neighborhoods are at high risk. Excessive heat can lead to dehydration, heat exhaustion, heat stroke and even death with prolonged exposure, and the most at-risk residents often lack financial resources to adapt.
Climate change is increasing temperatures in cities worldwide (photo: Pixabay/geralt)

Satellite instruments can identify communities vulnerable to extreme heat because they can measure and map the surface urban heat island in high detail.

For example, industrial and commercial zones are frequently among the hottest areas in cities. They typically have fewer trees to cool the air and more pavement and buildings to retain and radiate heat.

Certain residential layouts are also more prone to higher surface temperatures than others. These neighborhoods usually have minimal vegetation, and homes are built close together, with more roads and sidewalks and little green space.

Often, especially in northern climates, homes in these neighborhoods were built with materials such as brick that retain heat to keep occupants warmer in the winter. Communities with many apartment buildings and stores surrounded by parking lots are also at high risk.

My research has found that on warm summer days, low-income communities of color can experience extreme heat conditions that are often more than 10 degrees Fahrenheit (5.5 C) warmer than surrounding areas. Other research has found similar differences among neighborhoods and stark racial and economic disparities when it comes to heat exposure.

One recent study found that the poorest areas were significantly hotter than the richest in 76% of urban U.S. counties. It also found that neighborhoods with large Black, Hispanic and Asian populations were in significantly hotter areas in 71% of counties, and that that difference remained even when adjusting for income. These areas tend to have less vegetation and a higher density of homes.

Another study looked at communities that had once been redlined, a discriminatory practice banks used in the early to mid-20th century to deny loans in racial and ethnic minority communities. Nationally, these formerly redlined neighborhoods were 4.6 F (2.6 C) warmer than nonredlined areas.

50 years of Landsat

Several satellite systems can now measure the surface urban heat island, but the Landsat program, which celebrates its 50th anniversary in 2022, provides decades of continuous, comparable data in the detail necessary to examine variations within a city.

That continuity helps scientists measure the impact of changes and track how development patterns change a neighborhood’s heat profile.

The first Landsat satellite was launched on July 23, 1972, with a sensor that collected data in green, red and near-infrared wavelengths that made it useful for mapping vegetation.

Beginning with Landsat 4, launched in July 1982, scientists could map and measure thermal characteristics of Earth’s surface. Today, Landsat 8 and Landsat 9 are operating, and a 10th is being developed.

How cities can use this data to help

There are numerous ways cities can use this data to help residents combat extreme heat.

In Indianapolis, local government and faith-based organizations have used extreme heat vulnerability indices, which use indicators of heat-health risk and past heat waves to highlight high-risk communities. Knowing which communities are likely to be at the highest risk allows them to guide outreach to the most vulnerable people both before and during periods of elevated temperatures.

New York’s “Cool Neighborhoods NYC” program includes strategically planting trees and vegetation to increase shade and evapotranspiration, which cools the surrounding area. It also discusses painting roofs and pavement light colors to reflect solar energy and educating at-risk communities about heat risk and ways they can get help.

As the climate continues to warm and affect urban health, the Landsat satellites’ sensors are among our best tools for monitoring the thermal variations of the urban heat island. Such work also serves as one of the best examples of employing satellite-based measurements to monitor and implement response to public health threats.

This article was written by Daniel P. Johnson, an associate professor of Geography at IUPUI in the United States. It is republished from The Conversation under a Creative Commons license. Read the original article.

Did you like it? 4.5/5 (21)
Subscribe to Our Newsletter

News, investigations, and analysis — our top stories every morning to start your day right.

Climate Change
Follow on Google News Follow on X (Twitter)
Share. Facebook Twitter LinkedIn Telegram WhatsApp Email Copy Link
Previous ArticleLinguistic diversity is key to saving the planet
Next Article Sustainable farming can revolutionize food security
Eirwen Williams
  • X (Twitter)

Eirwen Williams is a New York-based journalist at Sustainability Times, covering science, climate policy, sustainable innovation, and environmental justice. With a background in journalism acquired through a specialized program in New York, he explores how cities adapt to a warming world. With a focus on people-powered change, his stories spotlight the intersection of activism, policy, and green technology. Contact : [email protected]

Keep Reading
Illustration of a dramatic decline in flying insect populations in a remote Colorado meadow due to rising temperatures.

“72% of Insects Gone”: Scientists Discover Climate Change Annihilating Life in Colorado’s Most Remote Wilderness Areas

Illustration of ocean heatwaves affecting marine ecosystems across the globe.

“96% Of World’s Oceans Are Burning”: Record Marine Heatwaves Lasted 525 Days While Triggering Mass Coral Death And Fishery Collapse Worth Billions

Illustration of Australia drifting toward Asia, symbolizing the impending geological collision.

“Australia Will Crash Into Asia”: Continental Collision Already Disrupting GPS Systems While Scientists Warn Of Massive Extinction Event For Koalas And Kangaroos

Add A Comment

Comments are closed.

Subscribe to Our Newsletter

News, investigations, and analysis — our top stories every morning to start your day right.

Trending
Illustration of the sophisticated water management system beneath the Pyramid of Djoser in ancient Egypt.
“14 Million Cubic Feet Water Reservoir”: Ancient Egyptians Built Sophisticated Dam System Beneath Pyramid of Djoser for Hydraulic Construction
Illustration of Mark Steven Zuckerberg, an attorney from Indianapolis, dealing with social media account suspension issues due to name confusion with Meta's CEO.
“Five Account Suspensions in Eight Years”: Indianapolis Attorney Mark Zuckerberg Sues Meta Over Mistaken Identity With Billionaire CEO
Illustration of Mark Zuckerberg's superyachts, Launchpad and Wingman, navigating the fjords of Norway for a heliskiing adventure.
“$330 Million Fleet Crosses 5,280 Miles”: Mark Zuckerberg Uses Two Superyachts to Bypass Norway’s Helicopter Landing Regulations
News by category
  • Featured
  • Cities
  • Climate
  • Energy
  • Impact
  • Markets
  • Opinions
  • Policy
  • Reports
  • Research
Information
  • About Us
  • Meet the Team
  • Advertise
  • Contact Us
  • Legal Mentions
  • Privacy Policy

Subscribe to Our Newsletter

News, investigations, and analysis — our top stories every morning to start your day right.

Facebook X (Twitter) LinkedIn YouTube TikTok
© Sustainability-Times.com. All rights reserved.

Type above and press Enter to search. Press Esc to cancel.